To ESG Investors and Experts
Water Security
Policy
Policy on Water Use Reduction
As part of environmental management, we provide education on water con-servation to our employees and top tenant employees.
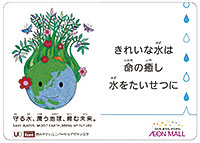
We attach stickers (see below) to utility areas around each mall. We also en-courage the reduction of water usage throughout our mall facilities, asking for the cooperation of both employees and customers.
Initiatives
The AEON Group participates in the Ministry of Environment Water Project, communicating the importance of water, including securing water resources and water security.
By communicating the water-related initiatives of this project, we aim to raise environmental awareness among the public and work together to address water recycling, securing water resources, and other issues related to water.
Water Use
Initiatives to reduce water use
We install water-saving fixtures and equipment in all AEON MALL facilities, using rainwater, well water, recycled water, and/or industrial water where allowed by location, mall structure, etc.
We ask for the cooperation of our specialty store tenants in conserving water.
Water Risk
Measures to mitigate the impact of drainage and surface runoff
In preparation for heavy torrential rains, we install regulating ponds at each mall site depending on location. The purpose here is to store rainwater temporarily, thereby contributing to the reduction of water damage across wide areas of land.
Rain that falls on paved roads and parking lots can mix with substances contained in gasoline and exhaust fumes as it flows over the ground surface. Certain malls allow rain that falls on parking lots to infiltrate into the ground through rain gardens, where soil and plants help filter out pollutants and circulate rainwater.
Water Withdrawal
Total water withdrawal
| Unit | Scope*1 | Boundary | FY2016 | FY2017 | FY2018 | FY2019 | FY2020 | |
|---|---|---|---|---|---|---|---|---|
| Total water withdrawal | ㎥ | ① | Entire structure | 9,541,423 | 10,023,355 | 79,998,186 | 9,969,117 | 8,105,434 |
| Total water withdrawal | ㎥ | Overseas | Entire structure | 4,702,551 | 5,200,736 | 6,476,457 | 6,806,827 | 6,443,289 |
| Total water withdrawal | ㎥ | ② | Entire structure | 14,243,974 | 15,224,091 | 16,474,643 | 16,775,944 | 14,548,723 |
② Consolidated. (Includes overseas and subsidiaries)
| Unit | Scope*1 | Boundary | FY2016 | FY2017 | FY2018 | FY2019 | FY2020 | |
|---|---|---|---|---|---|---|---|---|
| Total water withdrawal | ㎥ | ② | Entire structure | 14,243,974 | 15,224,091 | 16,474,643 | 16,775,944 | 14,548,723 |
| Industrial water | ㎥ | ② | Entire structure | — | — | 614,676 | 603,063 | 6508,325 |
| Well water | ㎥ | ② | Entire structure | — | — | 2,714,633 | 2,746,228 | 2,480,549 |
② Consolidated. (Includes overseas and subsidiaries)
Drainage
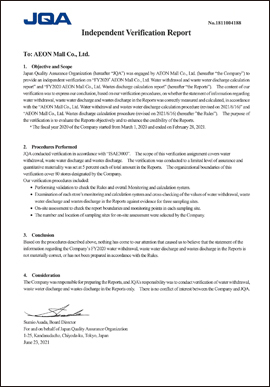
Third-party verifications
We obtained third-party verification for fiscal 2020 water drainage at 80 directly operated AEON Mall stores. We will strive to improve the reliability of the data and continue to reduce water emissions.
Scope of verification
Verification procedure
Total wastewater volume
| Unit | Scope*1 | Boundary | FY2016 | FY2017 | FY2018 | FY2019 | FY2020 | |
|---|---|---|---|---|---|---|---|---|
| Total wastewater (sewage) volume | ㎥ | ① | Entire structure | 7,903,120 | 8,465,501 | 8,719,243 | 8,798,918 | 7,213,636 |
| Total wastewater (sewage) volume | ㎥ | Overseas | Entire structure | 4,702,551 | 5,200,736 | 6,476,457 | 6,806,827 | 6,443,289 |
| Total wastewater (sewage) volume | ㎥ | ② | Entire structure | 12,605,671 | 13,666,237 | 15,195,700 | 15,605,745 | 13,656,925 |
② Consolidated. (Includes overseas and subsidiaries)
* Wastewater drains to sewage only. There is no drainage to ocean, surface, underground, etc.