To ESG Investors and Experts
Environmental Data
Total waste output and recycling rates for FY2020
Recycling rate (including thermal recycling) for directly managed malls in Japan: 88.7%
| Output volume by category and recycling rate | |||||||
|---|---|---|---|---|---|---|---|
| 1 | Raw garbage | 10,959t | 85.1% | 2 | Cardboard | 19,732t | 100.0% |
| 3 | Mixed garbage | 16,864t | 75.2% | 4 | Waste plastics | 2,881t | 92.7% |
| 5 | Waste plastics (valuable) | 77t | 100.0% | 6 | PET bottle | 512t | 100.0% |
| 7 | Glass bottle | 277t | 95.6% | 8 | Can | 461t | 100.0% |
| 9 | Styrofoam | 119t | 100.0% | 10 | Waste oil | 1,602t | 100.0% |
| 11 | Paper | 2,305t | 100.0% | 12 | Large garbage | 201t | 65.2% |
| 13 | Other non-combustible waste | 1,111t | 60.1% | 14 | Fluorescent bulb | 14t | 85.3% |
| 15 | Waste battery | 11t | 87.3% | 16 | Disposable chopsticks | 85t | 98.0% |
| 17 | Waste alkali/paint remover | 15t | 25.5% | 18 | Sludge | 5,934t | 90.5% |
FY2020 Inputs / Outputs (80 malls in Japan)
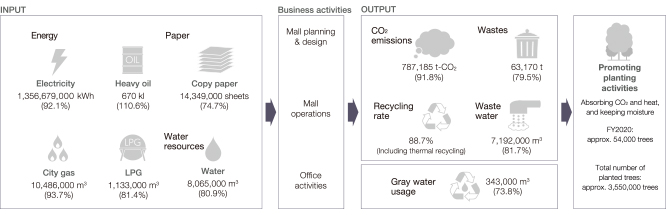
- Note 1: For the whole mall including common use spaces, AEON and speciality stores. However, waste and the recycling rate apply to speciality stores and AEON MALL office, and copy paper applies to AEON MALL office only.
- Note 2: Figures in parentheses are percentages over the previous year.