
HOME > About ÆON MALL > ÆON MALL’s Business Model > Earnings Structure Image
ÆON MALL’s Business Model
Leveraging expertise honed as a specialist shopping mall developer, ÆON MALL is creating shopping malls that attract customers, and is elevating mall value through close partnerships with tenants.
The mission of ÆON MALL is to continually improve revenues after a shopping mall opens and raise its value. Using a basic format, we pursue the development of shopping malls that serve as a one-stop solution for customers who visit. Furthermore, we have the expertise to provide support for tenants that forms the basis for close partnerships. We are working with tenants to develop a range of initiatives to better attract customers, and to improve customer satisfaction by creating safe and comfortable shopping malls.
Earnings Structure Image
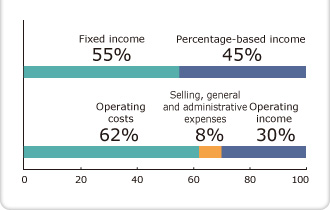
Fixed and Variable Percentages of Operating Revenue, Operating Costs, SG&A Expenses, and Percentage of Operating Income
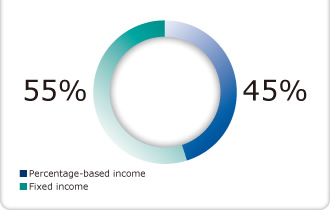
The majority of “income from real estate lease” within ÆON MALL operating revenue comes from “income from fixed rent” and “income from percentage rent,” the latter being determined in accordance with sales achieved by mall tenants. Consequently, when tenant sales increase, so too does the operating revenue for ÆON MALL. In many cases, ÆON MALL sets the minimum sales for each tenant on a monthly or yearly basis; therefore, despite their designation, percentage rents comprise an extra fixed rent component. The result is that ÆON MALL is not immediately impacted by lower tenant sales. Operating costs are costs directly related to mall management, comprised of personnel costs for employees stationed onsite for mall management and operating expenses related to mall facilities. Operating expenses are mainly comprised of facility maintenance expenses, water, lighting and heating expenses, rents paid to owners of mall land and buildings, and depreciation of mall facilities.
Composition Ratio of Fixed and Variable Income
Earnings Structure Image
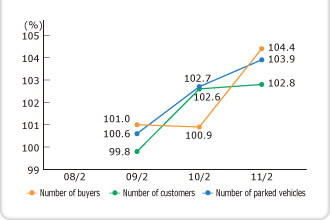
Number of Buyers /Number of Customers/Number of Parked Vehicles (YoY)
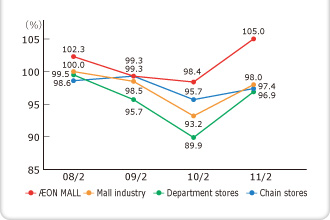
Year-on-year Comparison of ÆON MALL Sales to the Mall Industry, Department Stores and Chain Stores
-
- *
- Number of buyers, customers, and parked vehicles are omitted for fiscal 2007 as no figures were compiled.
-
Real Vacancy Rates and Percentage of Rents at ÆON MALL Shopping Malls Accounted for by Tenant Sales
| 08/2 | 09/2 | 10/2 | 11/2 | |
|---|---|---|---|---|
| Real vacancy rate* (end of period) | - | - | 0.7% |
0.4% |
| Percentage of rent at ÆON MALL shopping malls accounted for by tenant sales | 10.6% | 10.8% | 10.9% | 10.5% |
- *
- Real vacancy rate: The actual area of a mall vacant (excluding space reserved for incoming tenants based on gross leasable area).
- *
- The real vacancy rate is omitted for fiscal 2008 as no figures were compiled.